The way I think about whether Bitcoin price is going to rise or fall is by thinking about Bitcoin flows.
Predicting Bitcoin’s price is relatively easy and straightforward if you know the dollar amounts of all the flows at all times.
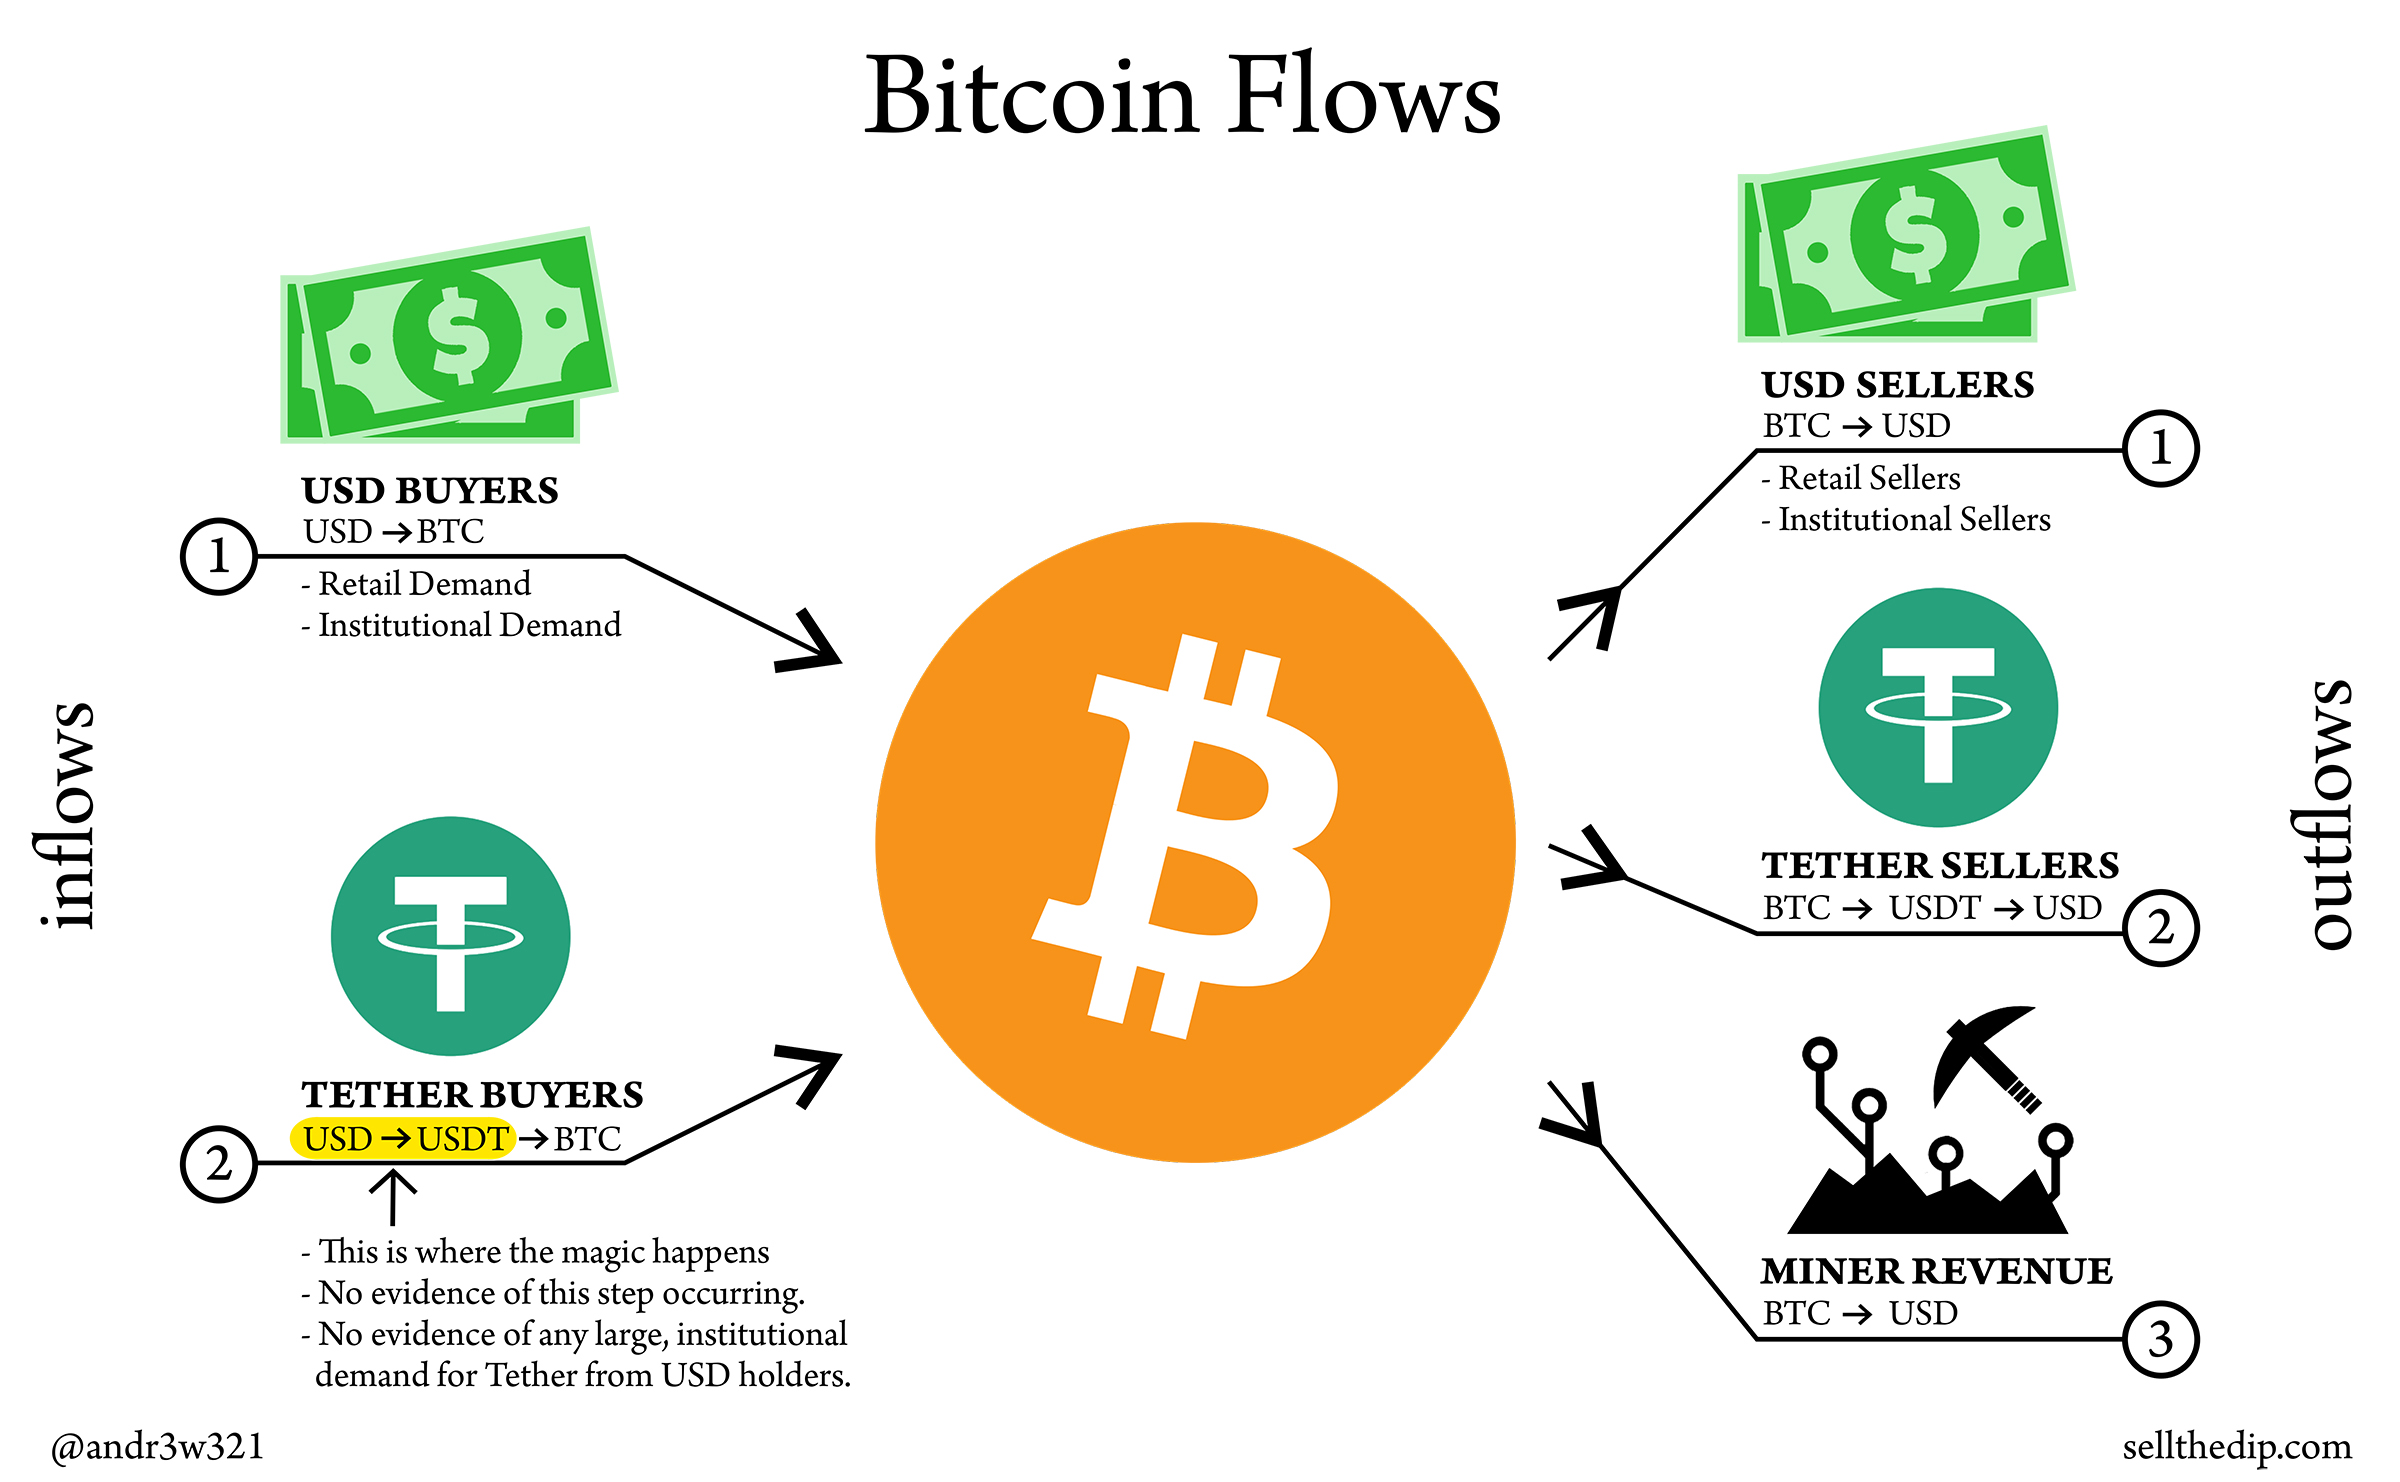
If Bitcoin inflows > Bitcoin outflows then Bitcoin price will rise to meet demand.
If Bitcoin outflows > Bitcoin inflows then Bitcoin price will fall to meet demand.
Unfortunately, 1) USD inflows and outflows are impossible to know without getting proprietary exchange data on deposits and withdrawals. The best alternative I’ve found is using something like google trends data to gauge sentiment. When people are googling “bitcoin” a lot, that means there is probably a lot of USD demand for bitcoin at any given time.
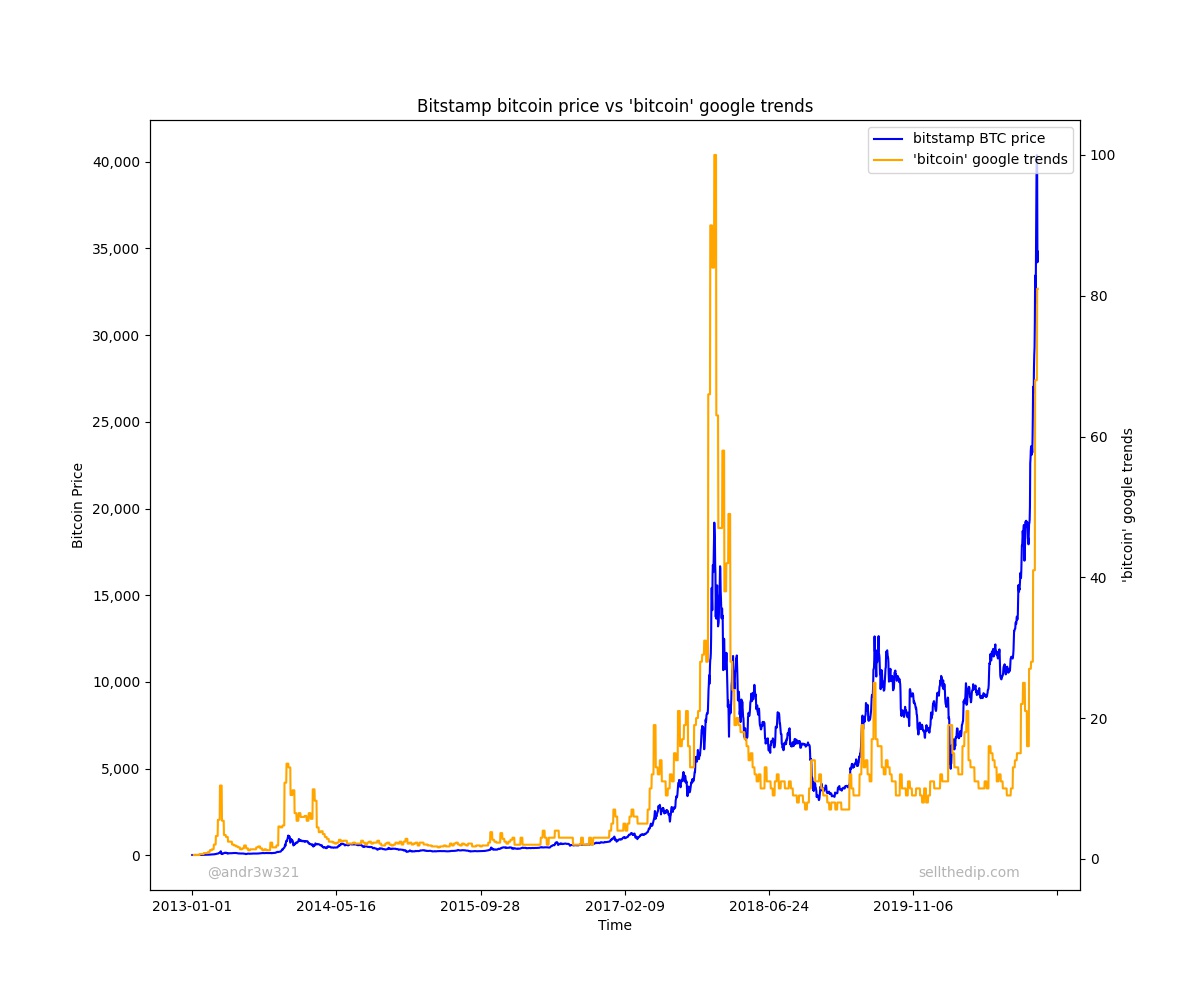
https://trends.google.com/trends/explore?date=today%205-y&geo=US&q=bitcoin
Fortunately 2) Tether buyers and sellers and 3) Miner Revenue are known, published values that can be looked up easily. We can use these to create an incomplete, real time model of Bitcoin flows to predict future Bitcoin prices.
Tether buyers and sellers
First, we will look at USDT supply changes over time. The way that Tether is supposed to work according to the original Tether white paper is that Tethers are created when people buy USDT with USD and Tethers are destroyed when people redeem USDT for USD. Therefore, the only way for the total supply of USDT to grow is for the amount of USDT buyers to be greater than the amount of USDT sellers.
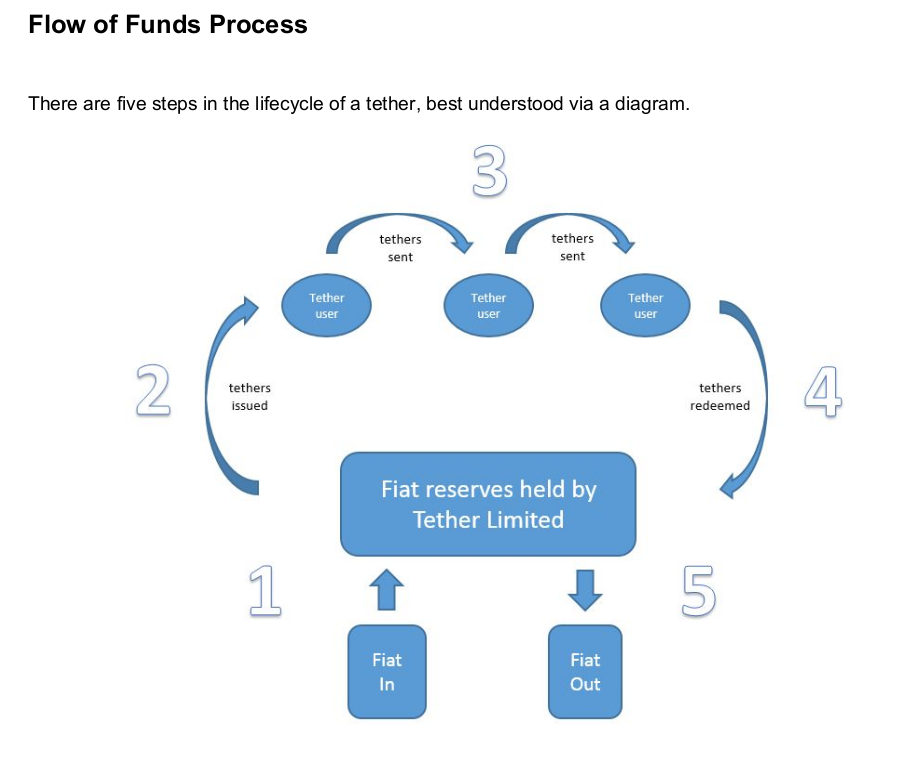
You can easily model Tether flows by looking at the growth or decline in USDT supply over time. When USDT supply is growing that means there are net inflows into Tether, and when USDT supply is declining that means there are net outflows from Tether.
Unfortunately, as far as I know, Coingecko does not provide USDT Supply data directly so I had to indirectly calculate it with USDT market cap / USDT price. As I stated in my last post, their USDT price is calculated in a complicated manner, so it may cause some irregularities in the data. Here is USDT supply over time.
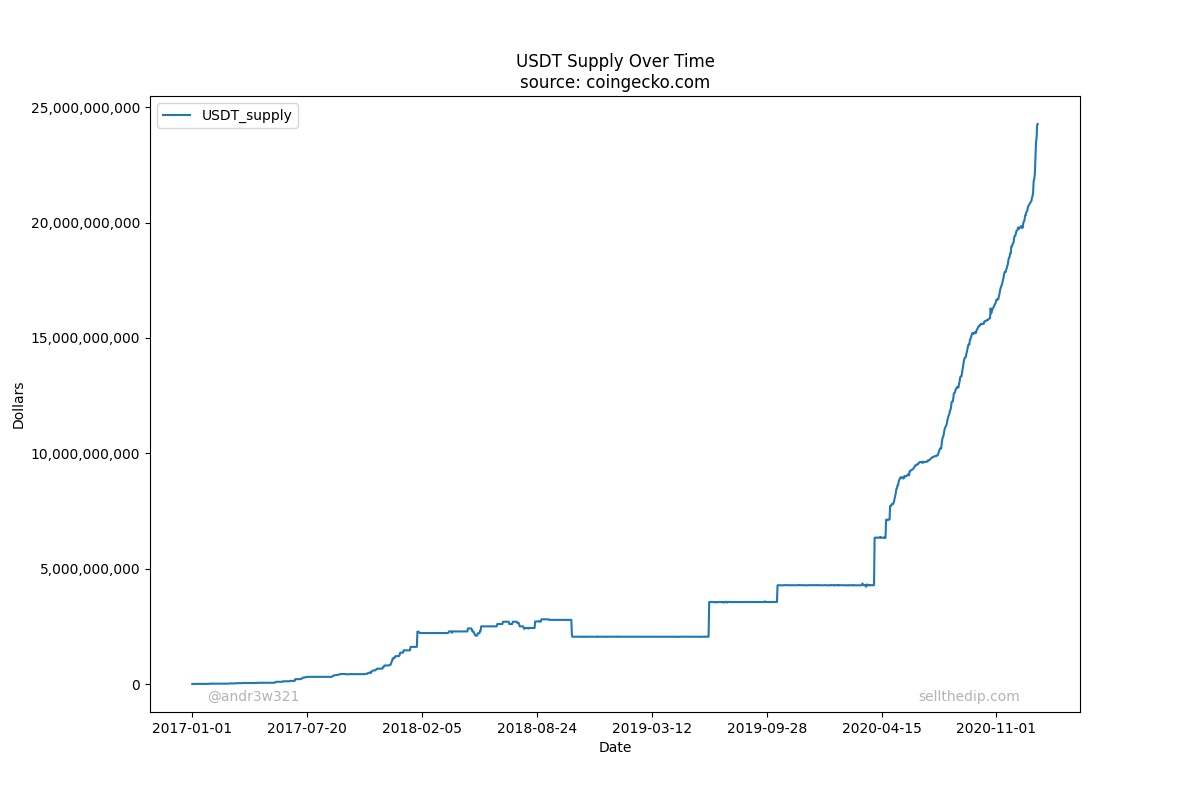
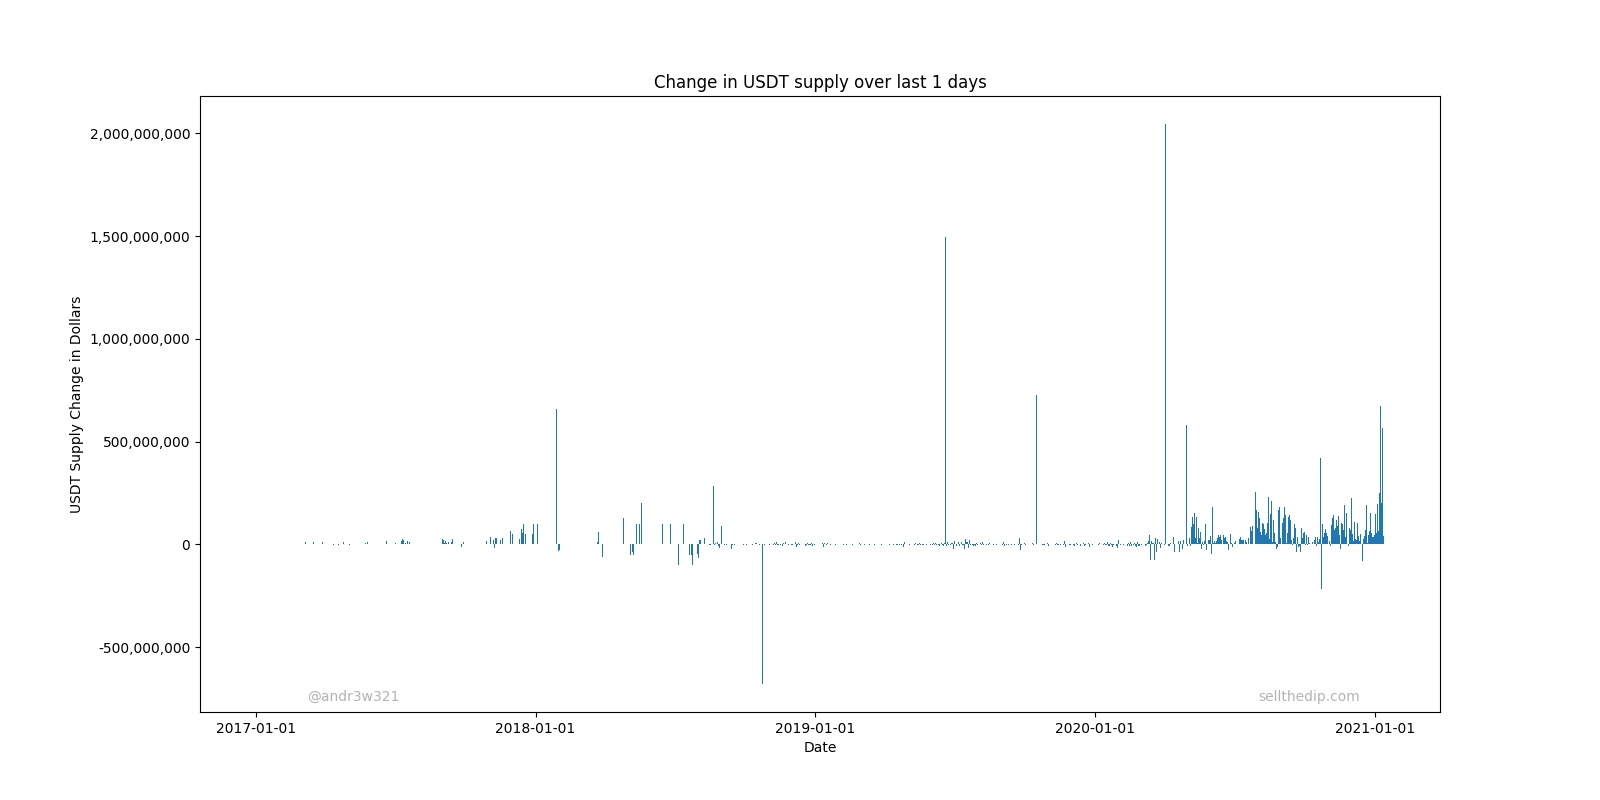
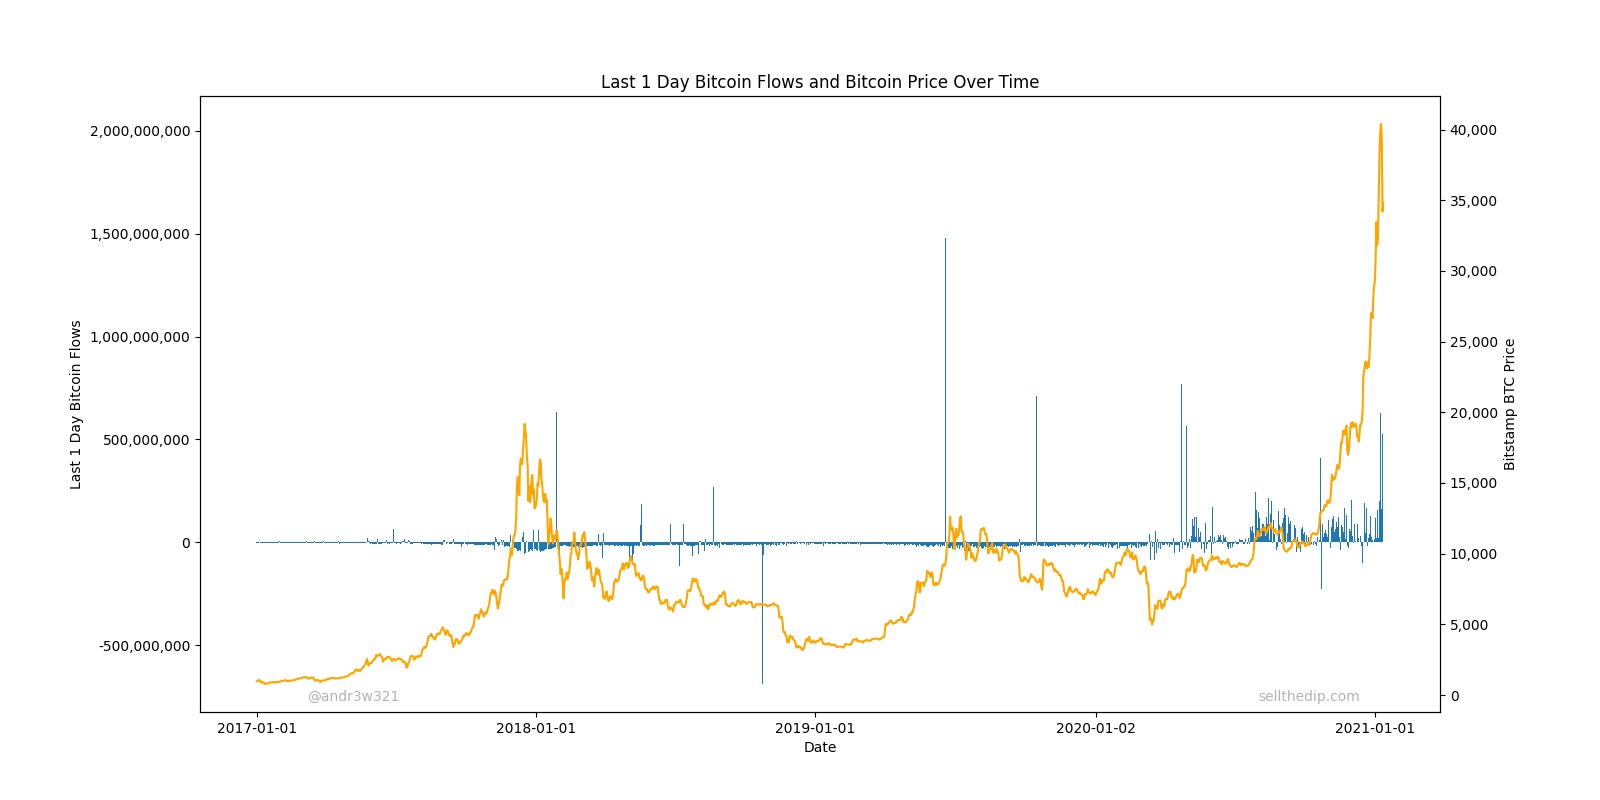
To properly look at flows, you should graph the net increase or decrease over time. You can look at flows on a daily basis with USDT supply – USDT supply 1 day ago:
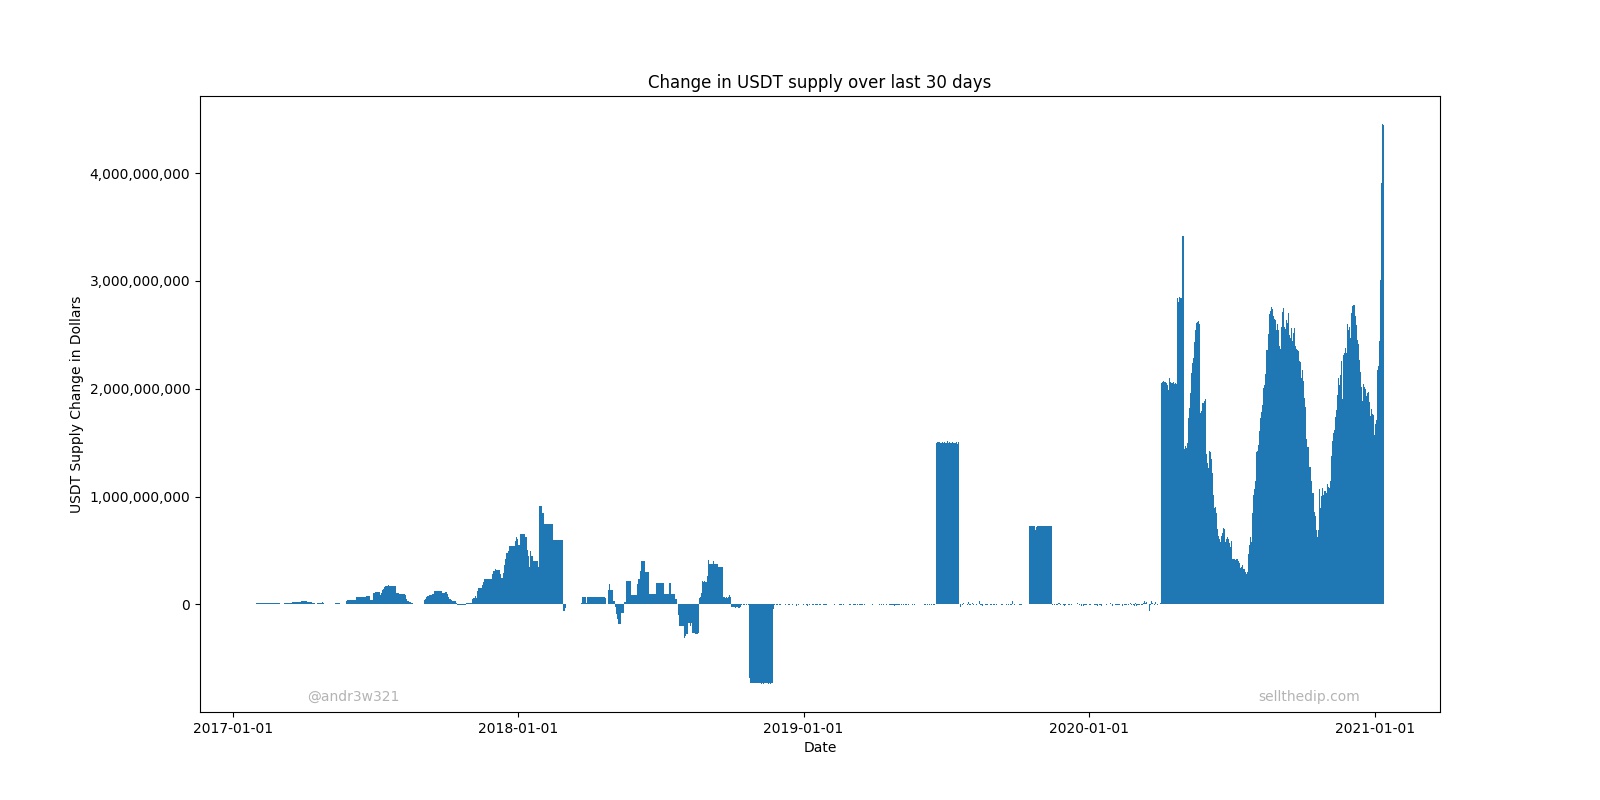
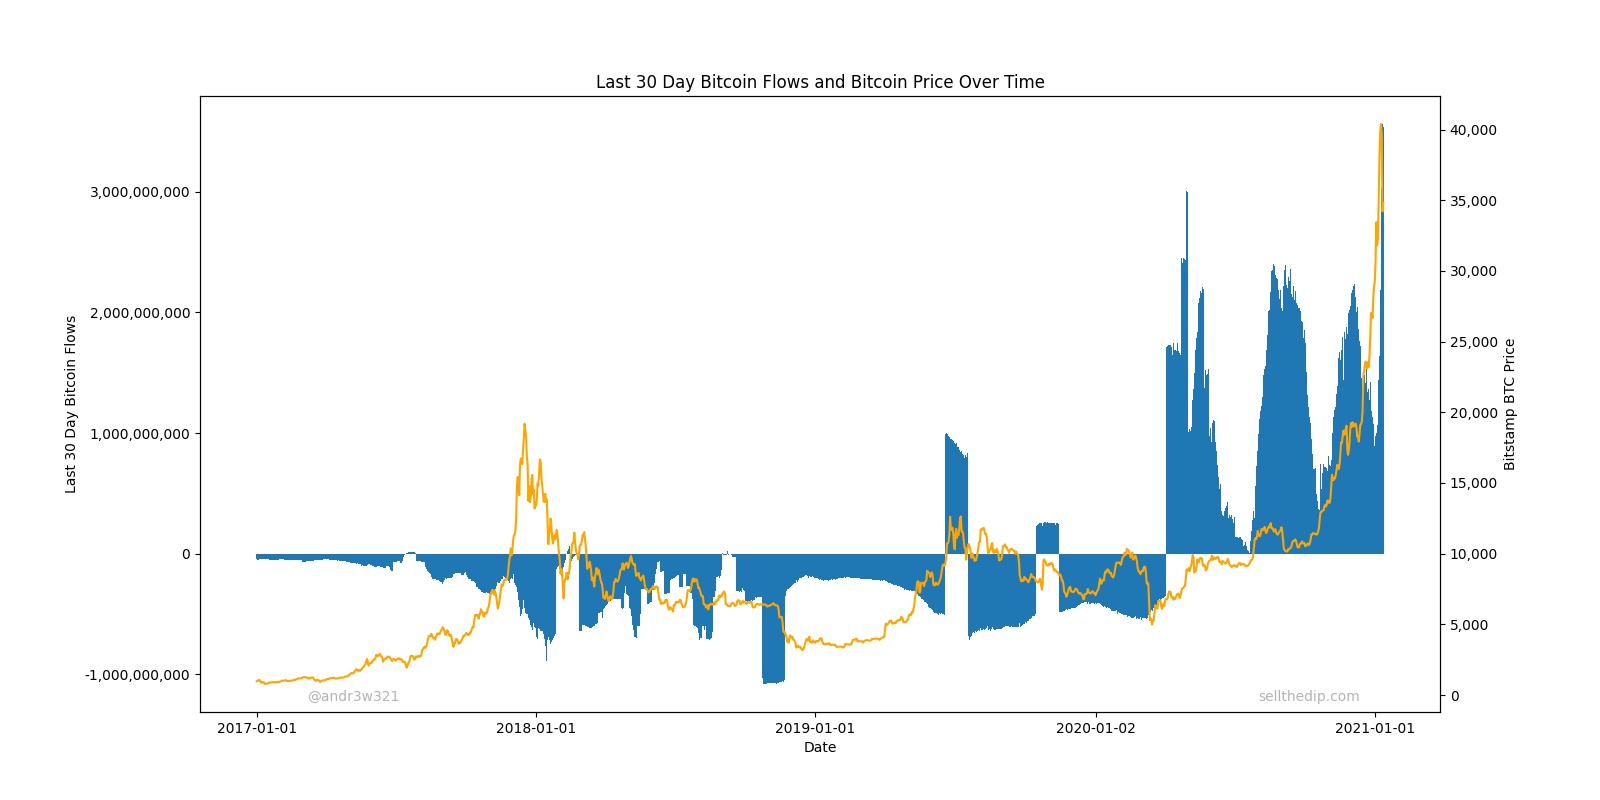
Or you can look at flows on a longer time frame basis. Here is a chart of USDT supply – USDT supply 30 days ago:
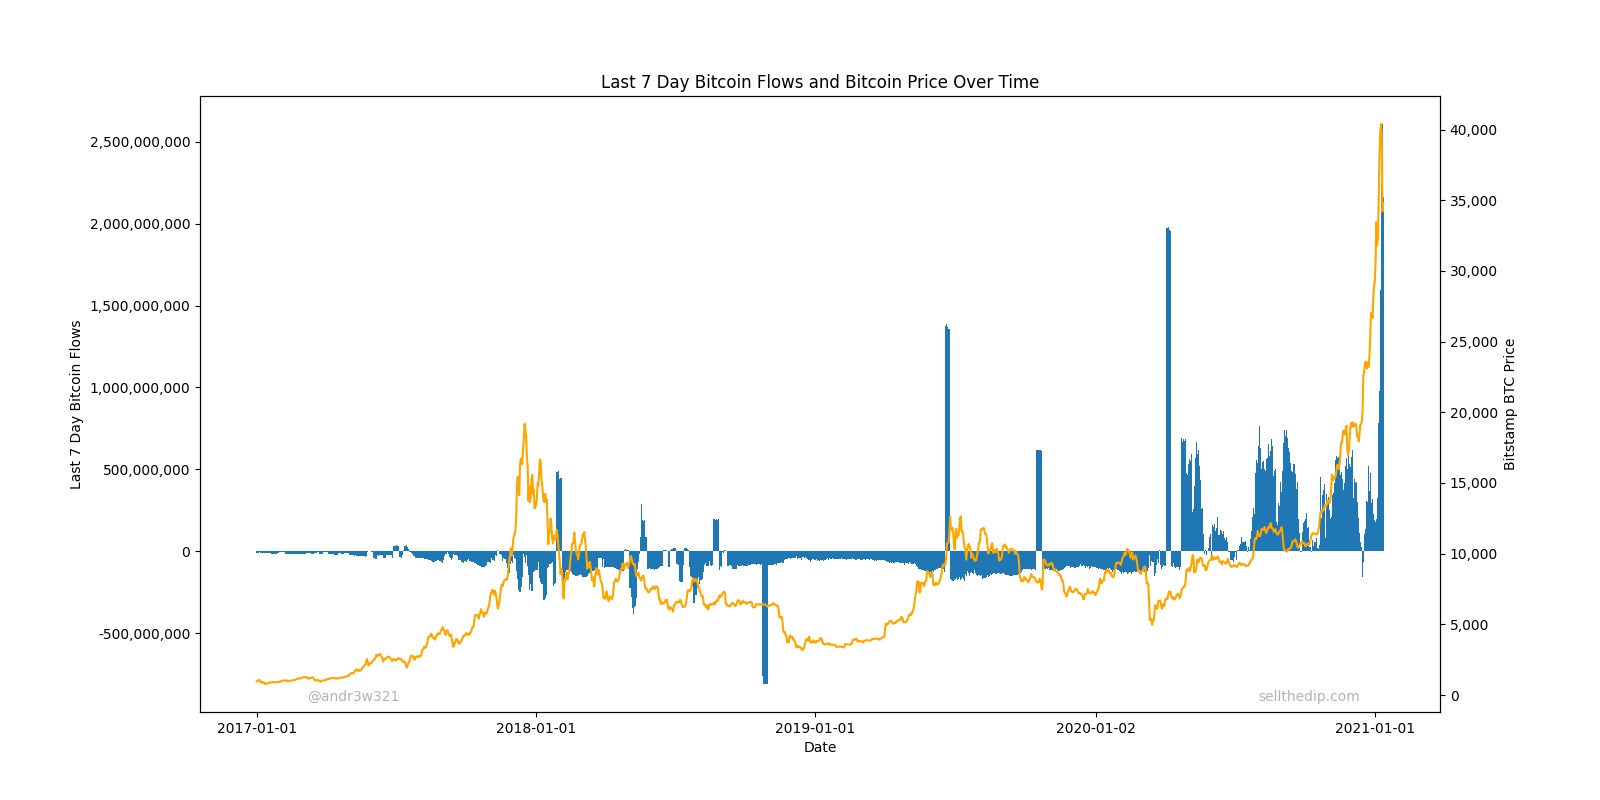
You can then try to predict future Bitcoin prices based on these flows.
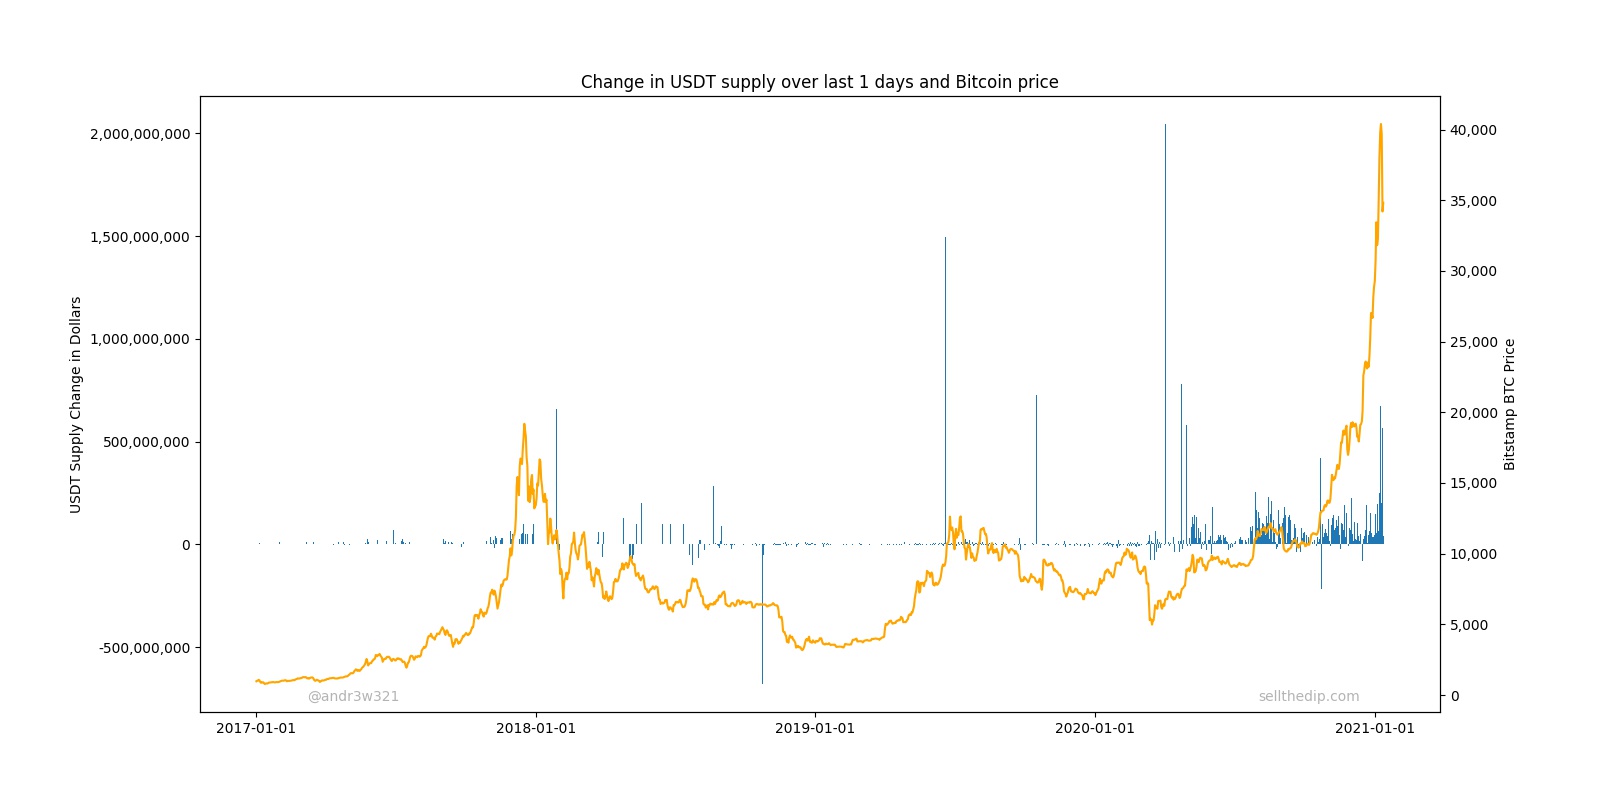
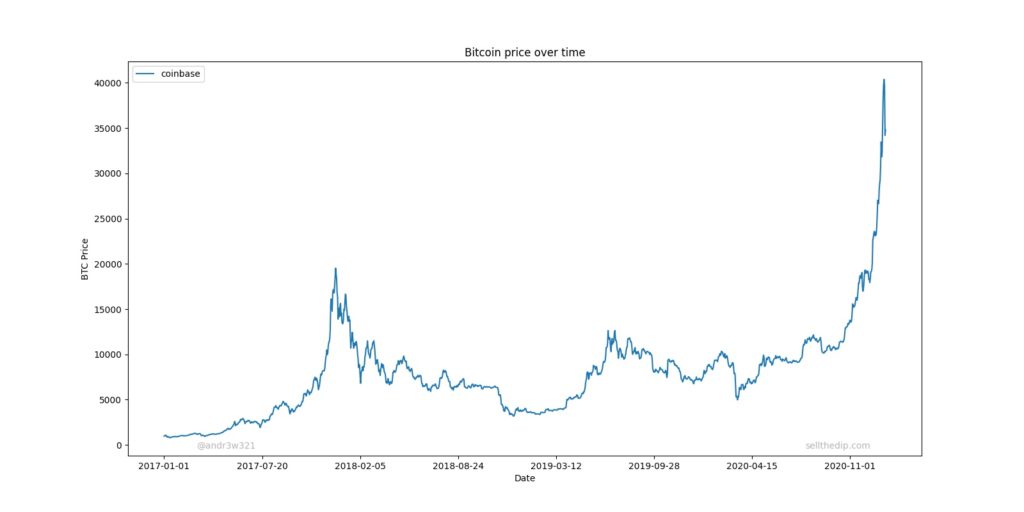
You can clearly see that large USDT supply increases precede several large increases in Bitcoin price and several large USDT supply decreases precede drops in Bitcoin price. Below is a table of Pearson Correlation Coefficients or R values showing change in USDT supply over a period of days vs future Bitcoin returns since 1/1/2018.
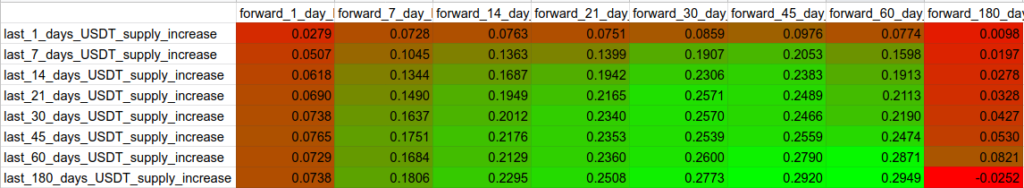
You will notice that Tether flows have a low correlation to very short term price predictions, but high correlation to longer term predictions.
Now that we know that USDT printing is bullish and that USDT destruction is bearish for Bitcoin, it would be nice to know when Tether plans on printing or destroying USDT before it happens. You might think this is completely up to those in charge at Bitfinex, however, they are not immune from market forces. As I mentioned in my last post https://sellthedip.com/a-more-accurate-tether-price-history-chart/ the CoinbaseBTC/BitfinexBTC price is a good proxy for the true price of USDT. When the CoinbaseBTC/BitfinexBTC price is stable and >=1, it is safe to assume they will continue to print and it is bullish for Bitcoin. When the CoinbaseBTC/BitfinexBTC price is <1, it is safe to assume that Tether and Bitfinex will be forced to destroy USDT. This is bearish for Bitcoin. You can see this by charting the daily change in USDT supply vs the USDT price over time.
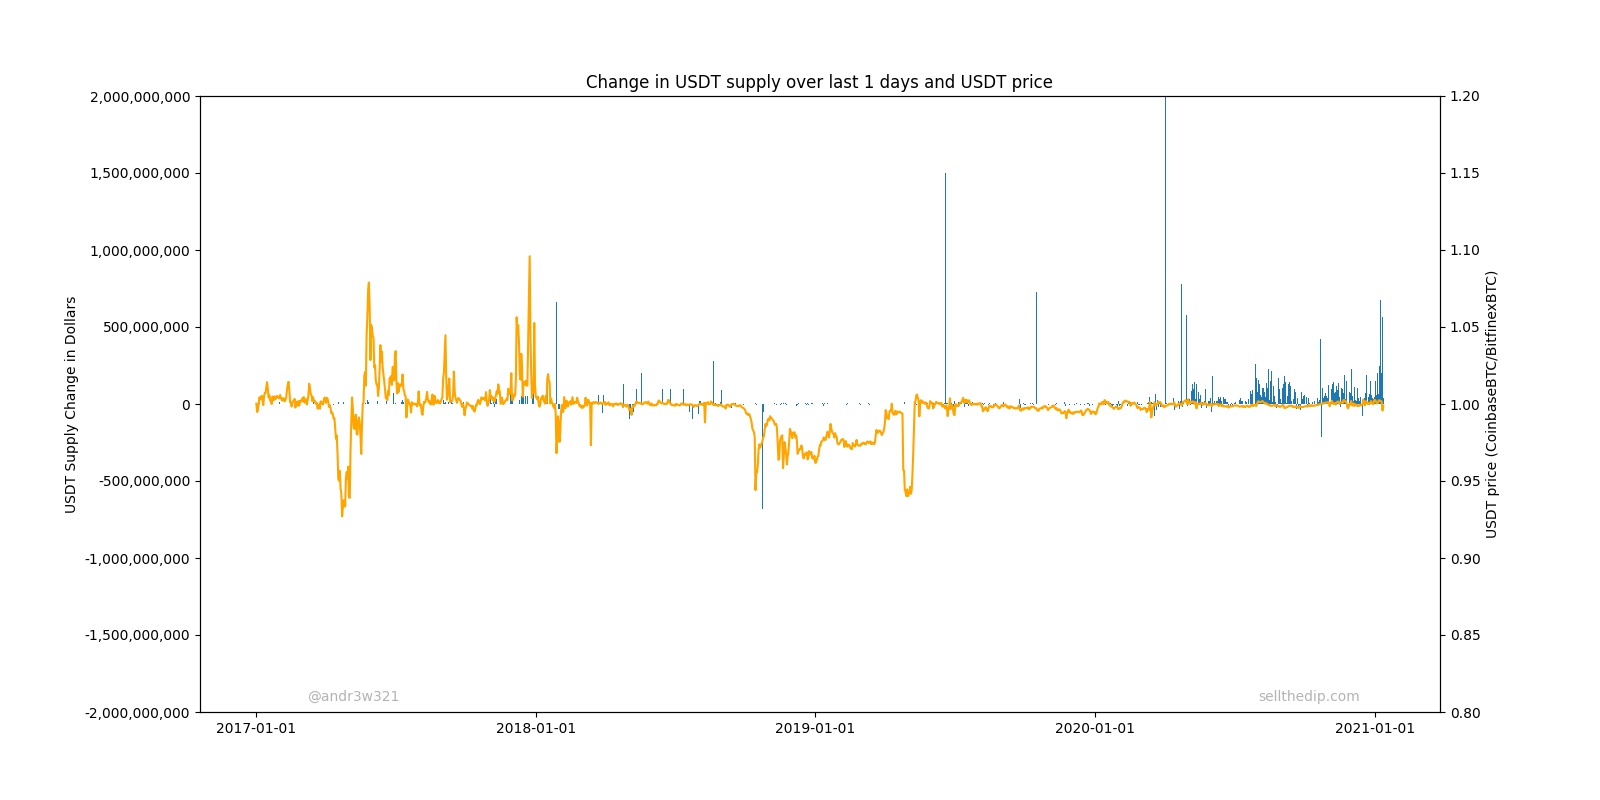
You can learn a lot from these charts. Sometimes printing too much USDT crashes the price of USDT. Sometimes USDT is destroyed after the price of USDT gets too low. The USDT price dropping below 1 for a sustained period of time (as it did in late 2018) prevents Tether from printing USDT and sometimes even forces Tether to destroy USDT. Destroying USDT has two effects: 1) It reduces the total supply of USDT in an attempt to increase the price of USDT, and 2) It crashes the price of BTC. It’s important to look at the price of USDT over time because it is a leading indicator of USDT being destroyed, which in turn is a leading indicator of Bitcoin crashing.
Miner Revenue
Next, we will look at Bitcoin miner revenue.
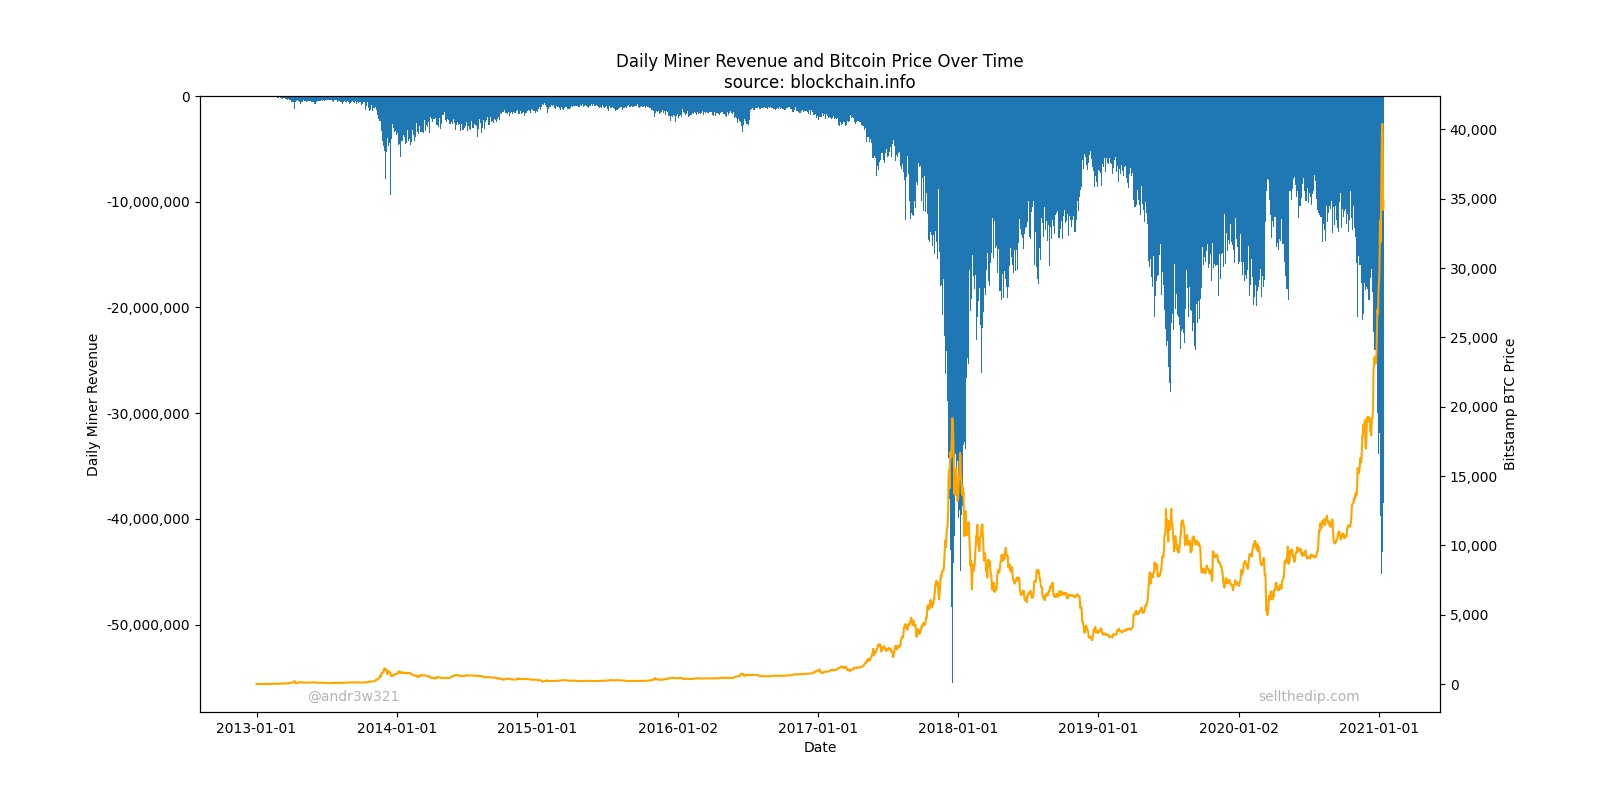
Bitcoin miners are net sellers of Bitcoin. They receive their payment in Bitcoin, but they pay their energy bills in fiat. In order to cover their expenses, they have to sell almost all the Bitcoin they receive as revenue for fiat. These miners provide a valuable service to the Bitcoin network by processing transactions and securing the network, but make no mistake about it, the more revenue they receive, the more selling pressure and negative flows it creates for Bitcoin. You can see in the chart that every time there is a large spike in Bitcoin price, Miner Revenue also spikes, and then Bitcoin price declines.
Theoretically, I don’t think Miner Revenue should provide much, if any, predictive power to Bitcoin price anymore than gold miner revenue predicts future gold prices. However, what I believe is currently happening is that enough USDT is being printed to offset what should be very bearish, huge Miner Revenue flows.
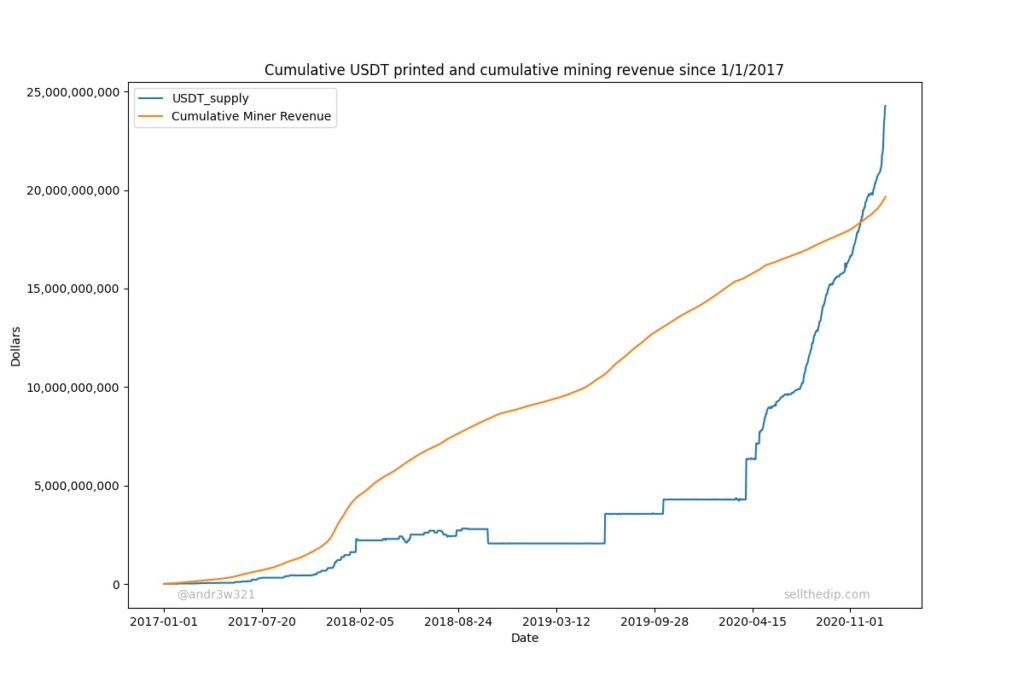
This is why exponentially more USDT has to be printed to keep the price of Bitcoin increasing. The higher the price of Bitcoin goes, the higher Miner Revenue goes, and the more Tether needs to be printed to offset those flows.
To finish the incomplete Bitcoin Flows model, you can subtract Miner Revenue from changes in USDT supply over a trailing number of days.
You can see that high Bitcoin Flows are usually lower in bear markets and generally higher in bull markets. You will also no doubt observe that current Bitcoin flows are very high, and this appears to be very bullish. Before you rush to buy Bitcoin on 10x leverage based on my charts, please remember a few things:
First, this model is incomplete because these flows are incomplete. The most important part of Bitcoin flows 1) USD buyers and USD sellers are not included. During early December 2017, there was clearly huge USD buyer demand and very little selling demand. By the end of the month, after prices had peaked, the flows had clearly reversed and there was huge selling pressure at highly elevated prices. What the crowd buys today, they may want to sell tomorrow. A declining ‘bitcoin’ google trends data following a massive spike, such as what we are currently experiencing, is undefeated in predicting a bear market. Ignore it at your own peril.
Second, looking at these flows and getting excited to invest is like looking at past fraudulent accounting statements for a company, seeing how well that stock has performed, and assuming it will continue in this way forever. Eventually, the crash comes and then the regulators step in and shut it down.
Additionally, looking at the Bitcoin flows charts above, take note that there is nothing special about the zero on the y-axis. In a typical day, the USD buying demand is probably higher than USD sellers by several million dollars worldwide which would shift all the flows slightly upward if you were to model USD demand that way.
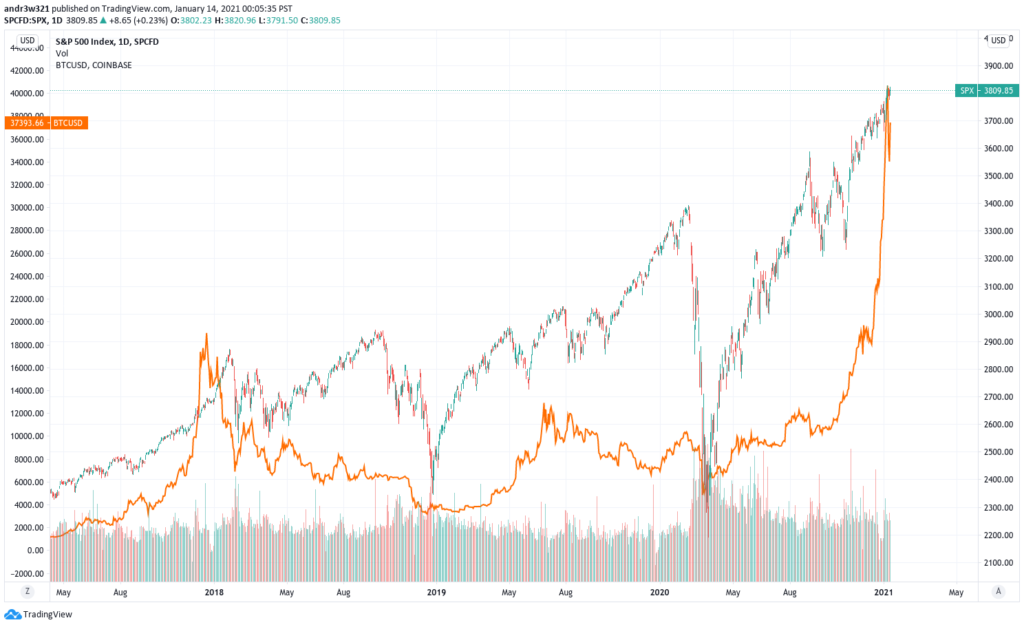
Bitcoin and the broader market
The March 2020 stock market crash showed that Bitcoin is a “risk on” asset. Bitcoin crashed along with almost everything else. With increasing institutional demand comes increased correlation to other risky assets like stocks. Tether can print all they want, but they are not immune from macroeconomic forces. If the stock market crashes again, Bitcoin will certainly tumble with it. From mid February to mid March of 2020 Bitcoin crashed more than 60% from $10,500 to $4,000. Since the market lows, SPY is up ~200% while Bitcoin is up 1,300%. If returns are amplified on the way up, they will be amplified on the way down as well. Investing in Bitcoin at its current price level should provide similar returns as investing in Tesla stock, Apple calls or SPY calls. Conversely, shorting Bitcoin at these levels should provide similar returns as shorting Tesla stock or buying puts on Apple or SPY.
Is Bitcoin headed higher or lower?
I have no idea. Please stop DMing me and asking me. These are the indicators that I look at:
- USDT Price or CoinbaseBTC/BitfinexBTC is bullish.
- USDT Supply Changes is very bullish.
- Miner Revenue is bearish, but more than offset by USDT supply increases.
- Google Trends is neutral, but flashing warning signs of going very bearish any day now.
- Stocks are bearish and overbought in the short and long term by almost any indicator you look at.
- Government regulation is very bearish in the long term. Eventually Tether will get shutdown. I have no idea when.
Overall, I am short term (days to weeks) bullish and long term (weeks to months) bearish on Bitcoin. It is way too early to short. I would wait for the USDT:USD 1:1 peg to break for a sustained period of time which would shutdown the Tether printer. It is also very risky to go long here. There is probably a little upside left in this bubble, but there is tremendous risk to the downside. 50k and 10k price targets are both likely to be hit in the near term. In the longer term, 100k and 5k are both quite possible.
If you found this post helpful, tips are always appreciated, but never expected. Best of luck and happy trading.
BTC: 37w2snDeY2DPVaxFYtUhsS6wzucbybTGvx
ETH: 0xD6b3F223d33AAaFbbFd3Ca52F5C12F021243F496